
In the world of consumer electronics, not all gadgets are created equal. One smartphone lasts for years without a hiccup, while another might feel flimsy or overheat under pressure. This blog post looks at how teardown-based benchmarking allows you to compare the build quality and performance-related design of competing products. By examining devices side by side, BLS can pinpoint who uses better materials, superior components, or smarter engineering – and how that knowledge helps you choose the right product to buy or improve your own designs.
Imagine you have your product and a competitor’s product on your lab bench. You disassemble both and lay out all the parts for a direct comparison. This process is at the heart of competitive benchmarking: a structured evaluation of how products stack up against each other on key attributes. For example, let’s say we’re comparing two high-end noise-cancelling headphones. A teardown might reveal that Competitor A uses memory foam for ear pads and metal hinges, whereas Competitor B uses cheaper foam and plastic hinges. It’s no surprise then if headphones A feel more comfortable and durable in everyday use. By cataloging such differences in materials and construction, a teardown explains the real-world quality gap that customers experience.
Key Quality Factors Revealed by Teardowns:
Component Quality: Are the electronic components (chips, capacitors, sensors) from reputable brands? Higher-grade components often mean better performance or longevity (for instance, a premium capacitor can last longer and provide more stable power than a bargain-basement one). If a competitor’s smartphone uses, say, a Sony image sensor for its camera while yours uses a smaller, no-name sensor, the teardown makes this clear – highlighting why their camera might perform better in low light.
Materials and Durability: What materials are used in the casing, chassis, or critical parts? Metal vs. plastic, thick Gorilla Glass vs. standard glass, waterproof seals or none – these choices drastically affect a product’s feel and durability. A teardown inspection can find features like rubber gaskets for water resistance, shock-absorbing mounts for a hard drive, or the presence (or lack) of cooling systems like heat pipes. Such findings directly correlate with quality; for example, a laptop with two cooling heat pipes and dual fans can sustain performance under load better than a rival with a single small fan, explaining why one stays cool and fast while the other throttles speed.
Design and Workmanship: Sometimes it’s not the parts but how they’re put together. We look at soldering quality on circuit boards, routing of wires, reinforcement of stress points, and modularity. A well-designed product might have modular components (making it easier to repair or less prone to certain failures) whereas a poorly designed one might have fragile ribbon cables poorly routed near sharp edges. These are subtleties a teardown catches. Does a device have lots of loose space inside (wasted volume) or tightly packed efficiency? All these aspects reflect the level of engineering care.
Bringing Value to Buyers and Designers: If you’re a buyer evaluating a product, such as a procurement manager deciding between two suppliers, BLS’s quality benchmarking analysis can be your safeguard. We might teardown sample units from each supplier to see if, for example, one uses higher-purity solder or more robust connectors – factors that could affect long-term reliability. This protects you from simply relying on spec sheets or marketing claims; you get an evidence-based assessment of build quality. On the other hand, if you’re a product designer, these insights guide where to focus improvements. You might find that competitors consistently use a specific type of chip coating to prevent corrosion in their outdoor devices – prompting you to consider the same. Or benchmarking might reveal your product actually has a better battery and speaker than the rival; that’s a marketing point you can proudly emphasize.
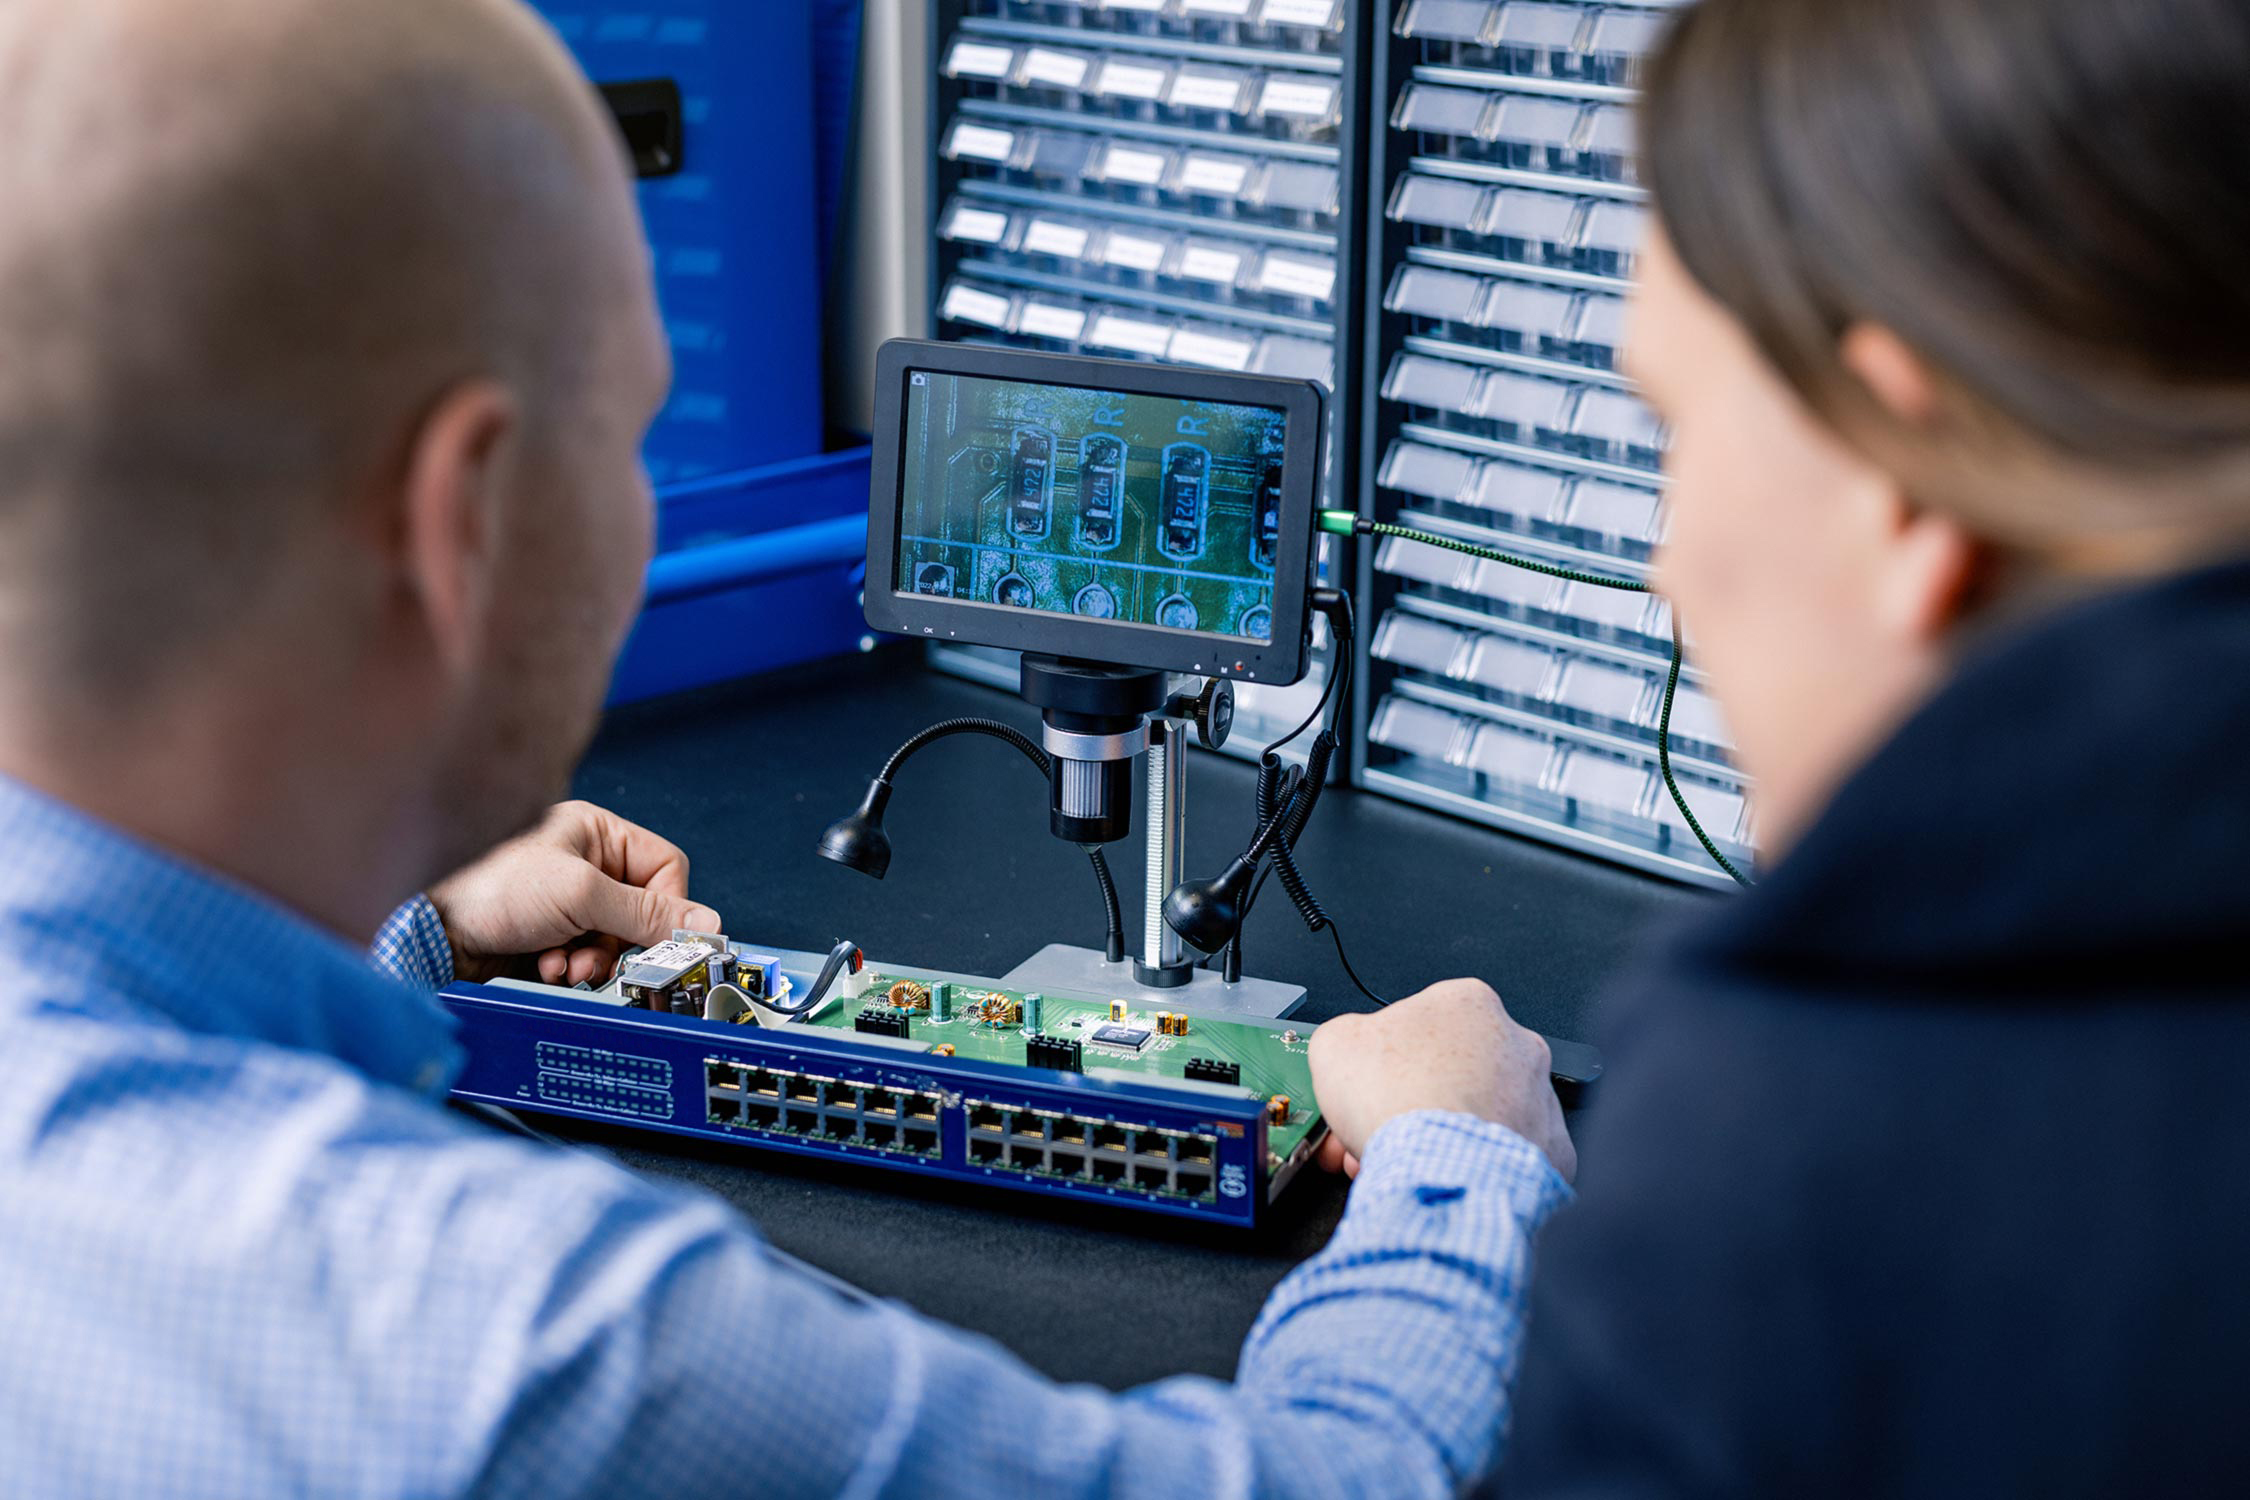
BLS conducts side-by-side product teardowns to give clients an objective comparison across any number of quality and performance factors. Our reports might include comparison tables (for example, “Competitor A vs Competitor B: Material of chassis, Battery capacity, Water-resistance features, Key chipset models, Assembly quality notes”) so you can clearly see where each product stands. We provide visual evidence – photographs of internals, microscope images of solder joints, etc. – along with our expert evaluation (e.g., “Competitor A’s use of XYZ power management chip likely contributes to its longer battery life and cooler operation, compared to Competitor B’s simpler design”). With BLS’s analysis, you gain the confidence of knowing how quality stacks up, rather than guessing. Whether the goal is to choose the right product to purchase or to learn how to build a better product, our teardown-based benchmarking shines a light on details that directly impact product excellence.